RapidCanvas
USE CASE: PROFIT & EARNINGS MODELING

Optimize profit potential with your existing data.

Finance teams across many industries can optimize profit and earnings results with multi-segment, multi-product analysis that aligns with current profit-and-loss reporting and desired margin performance.

The Profitability Challenge

Earnings improvements require accurate data inputs and rapid feedback loops.

Most organizations hold the revenue and cost data required to manage margin continuously, and the analytical layer that would convert it into a decision is produced on a periodic cadence. Business intelligence reporting requires manual interpretation, and financial planning and analysis consulting is delivered against a project calendar. Rates are set from historical cost assumptions and market averages, with limited visibility into which revenue lines vary with demand, volume, or occupancy, so margin pressure has persisted for a full period before it is measured.

Profit & earnings modeling / Where margin visibility is lost
Revenue & Cost Data
  1. Unanalyzed

    Financial Data Is Recorded

    Revenue, cost, and contract data are held in the general ledger and operating systems, and no continuous analysis is applied to them.

  2. Periodic

    Reporting Follows the Period

    Dashboards require manual interpretation, and advisory engagements are delivered against a project calendar, so margin is reported after the period has closed.

  3. Assumption-based

    Rates Rest on Historical Assumptions

    Rates are set from historical cost assumptions and market averages, with limited visibility into which revenue lines vary with demand, volume, or occupancy.

  4. Fragmented

    Units Are Compared Without a Common View

    Segments, properties, and product lines are reported separately, so capital and headcount decisions are made from incomplete information.

Next reporting cycleReturns to step 1
Solution Capabilities

Margin modeling and earnings impact ranking in one cohesive model.

Profit modeling anchors the solution, with supporting elements such as ranked earnings opportunities, cross-segment correlation, assumptions tracking, and actionable recommendations for continuous improvement.

Identifies the revenue lines most sensitive to changes in demand or occupancy by product, segment, or property, which establishes where a change in trading conditions has its effect on earnings.
Models base, upside, and downside pricing scenarios side by side at the segment level, so the range of outcomes is known while the rate decision remains open.
Ranks improvement opportunities by achievable earnings impact, so attention is concentrated on the short list of levers that account for most of the available gain.
States the assumptions behind every lever for review before action is taken, which allows a Chief Financial Officer to test the analysis and not accept it on trust.
Unifies margin performance across segments or properties in one comparable view, governed by the reporting structure already defined for the group.
Updates the margin view as revenue and cost data arrive, so profitability is a current reading at the point a pricing or allocation decision is made.
Profit Modeler screen showing an earnings bridge from current to modeled earnings across five ranked pricing and cost levers, with a recommendation to reprice the premium room rate before the filing window closes
Our Solutions Always Employ

The Hybrid Approach™ to Enterprise AI

Human-led, agent-executed, and context-driven by design.

RapidCanvas is the only partner with a Hybrid Approach™ that closes the execution gap between AI potential and real enterprise results by delivering solutions that are outcome-first, context-driven, and expert-optimized.

Agentic automation, custom data apps, access, security, and governance
Enterprise-Grade ArchitectureAgentic Automation | Custom Data Apps | Access | Security | Governance
+
Industry experts, AI engineers, customer success, and cloud-ops
Human ExpertiseIndustry Experts | AI Engineers | Customer Success | Cloud-Ops
Customer Benefits

Profit improvements with rapid results and long-term growth.

Apply with Current Intelligence

Profitability is available at the point a pricing or allocation decision is made, in place of a quarterly retrospective.

Govern Pricing with Range Boundaries

Scenarios across products, segments, and channels are modeled before commitment, so the range of outcomes is established while the rate is still open.

Prioritize by Earnings Impact

Improvement opportunities are ranked by achievable earnings impact, so finance and operating attention is directed to a short list.

Support Board-Level Scrutiny

Every number is traced to its source and to the business rule applied to it, which supports board and investor discussion.

Expansion Planning

Compounding IntelligenceEach solution makes the next one smarter.

RapidCanvas delivers profit and earnings modeling in the context of the surrounding revenue and planning use cases, with the financial and contract data shared across each.
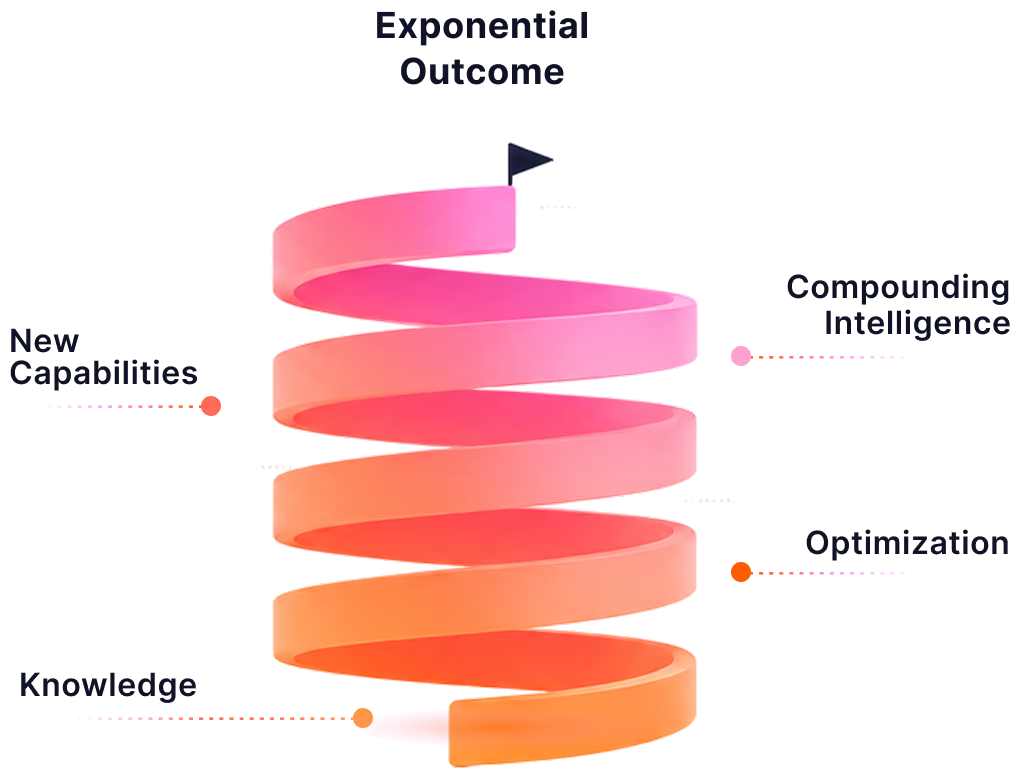
Upward spiral from knowledge to exponential outcomes through optimization, new capabilities, and compounding intelligence

The margin view is refreshed as revenue and cost data arrive, so it remains current between planning and reporting cycles.

Margin modeling pairs with revenue and pipeline growth, since account prioritization and profit modeling draw on the same governed revenue and contract data.

Margin sensitivity informs quote generation and pricing, so each offer reflects the contribution of the revenue line it belongs to.

Scenario planning extends the base, upside, and downside cases beyond pricing to demand, capital, and headcount assumptions.

4-Step Process

How to Get Started

Every RapidCanvas solution is built using the same four-stage process. From the system of record to the moment of decision. Four stages, one engine.

1

Design

Describe your problem in plain language, and the platform turns it into working pipelines and models.

2

Connect

Access all your business data in place, wherever it lives, without moving or duplicating it.

3

Implement

Move from Design into your real environment and tools, with experts guiding every key decision.

4

Govern

Compliance and monitoring run alongside the work, not as a bottleneck at the end.

See it on your own profit and loss.

Bring a trailing profit and loss statement by segment or property. We will show you the revenue lines most sensitive to demand, the pricing scenarios modeled side by side, and the levers ranked by earnings impact, and tell you whether the data you already hold supports a working solution.

Book a discovery call

Got questions? We're here to answer them for you

Have more questions?
Contact our support team to get what you need.

It models margin sensitivity against the cost structure, contract terms, and channel economics of the business, compares base, upside, and downside pricing scenarios at the segment level, and ranks improvement levers by achievable earnings impact. The assumptions behind each lever are stated so that finance leadership can review them before acting.
Business intelligence reporting describes a period that has closed and requires manual interpretation to reach a decision. This solution models how margin responds to changes in demand, volume, and occupancy, and returns a ranked set of levers with the expected earnings impact of each. The view is refreshed as data arrive and is not fixed at the close of a period.
An advisory engagement produces an analysis on a project calendar, and that analysis ages between cycles. This solution is built on the organization's own data and is refreshed continuously, so the analysis remains available for pricing and allocation decisions through the year. Finance leadership retains the assumptions and can adjust them.
Core inputs are general ledger and financial systems, revenue and transaction systems, cost and operations records, and pricing and contract records. External market context supplies the conditions for scenario modeling. The solution can begin with a subset of these sources, typically the profit and loss statement by segment or property, and be extended as further sources are connected.
The model measures how margin on each revenue line has varied with demand, volume, or occupancy in the historical record, separating fixed cost from variable cost. Lines whose margin changes most with those conditions are identified by product, segment, or property, which shows where a change in trading conditions has the greatest effect on earnings.
Base, upside, and downside cases are defined at the segment level, for example the current rate, a rate increase, and a rate decrease. Each case is modeled against the same cost structure and demand response, and the results are presented side by side so that the range of outcomes is visible before a rate is set.
Each lever, such as a pricing change or a cost adjustment, is assigned an estimated earnings impact based on the modeled sensitivity of the lines it affects. Levers are ordered by achievable impact, and the assumptions behind each estimate are stated, so the ranking can be reviewed and challenged.
Yes. Every figure is traced to its source data and to the business rule applied to it, and the assumptions behind each lever are stated before any action is taken. This allows the Chief Financial Officer and the board to test the analysis directly.
It is designed for finance leadership in hospitality, food and beverage, financial services, and real estate, and in other organizations that manage multi-property, multi-segment, or multi-product profit-and-loss statements. The typical starting condition is margin reported quarterly, with pricing set from historical cost assumptions.
The first step is a 30-minute discovery call. Bring the pricing and margin questions that matter most, and RapidCanvas will assess whether the revenue, cost, and contract data you already hold supports a working solution before any project scope is agreed.